Electrical, Electronics & Civil Maintenance Centre (EE&CMC)
E&IG @ ARCI is the Privileged contributor to R&D projects as well as support to all Industrial Multidisciplinary Equipment installed @ various centers
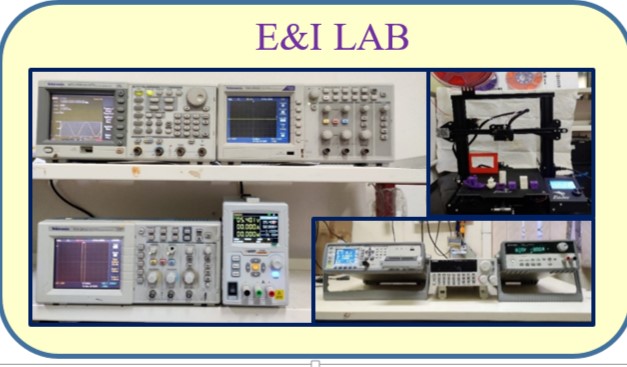
Electronics & Instrumentation is indispensable choice of every industry for process control, automation, troubleshooting and maintenance support.
Accomplishments by E&IG
- Developed an automatic hand sanitizer dispenser (IR based) as part of
- COVID-19 preventive measures at ARCI
- Magnetron PVD HIPIMs Interfacing and Integration
- LASER Lathe Interfacing
- Developed applications using LabVIEW software, Microcontrollers to control,
- Designed hardware and Proof of Concept test setups for R&D projects
- Replaced the copper infrastructure with the Fiber to the Home (FTTH) optical fiber technology in order to address repeated breakdowns of telephone communications due to underground copper cabling.
- Commissioning of UPS systems for equipment
Associated Projects
Advanced Detonation Spray Coating: Design and development of a PLC-HMI based automated ADSC
control system and preparation of the operation and schematics Manual.
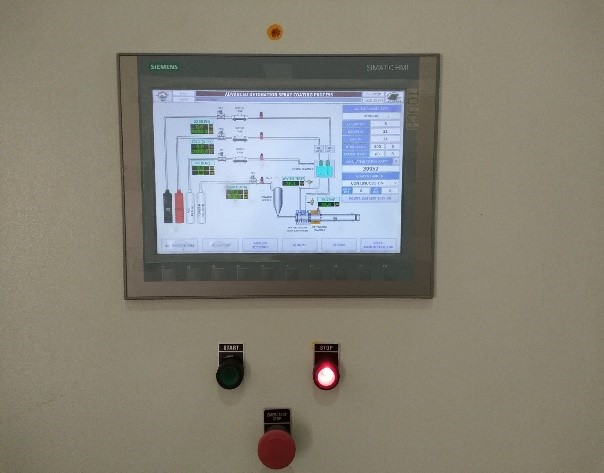
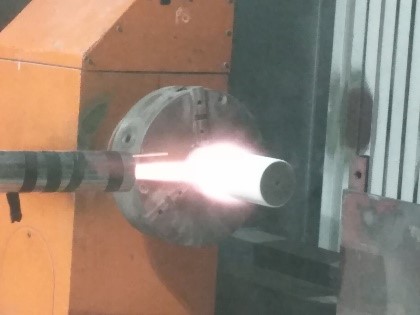
ADSC control system & Firing
Cold Spray Automation: Derived the technical specifications for the fabrication of a PLC-HMI based coating control process and completed the testing of integrated system.
Capacitor Management System:Associated with the design and development of
a Capacitor
Balancing and protection board for ARCI super capacitor bank and integration of the same with the bicycle along with charge /discharge controller.
The same has been demonstrated.
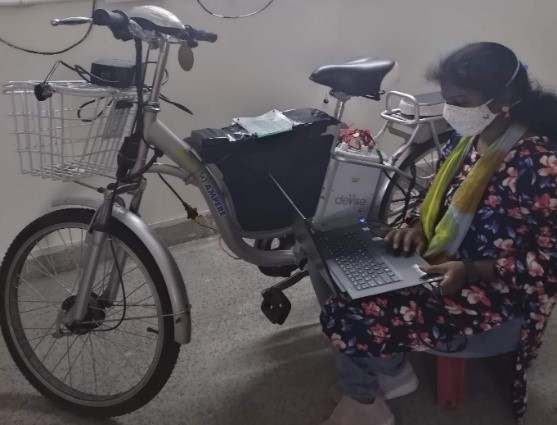
Testing of Supercapacitor powered Bi-Cycle
- Developed 16 channel data acquisition system for recording the charging and discharging profiles of individual Supercapacitors in a bank
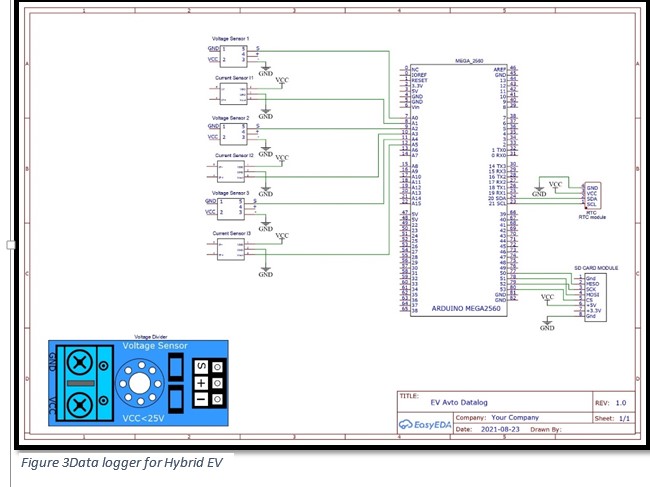
- Customized EV Data Logger: Development of EV Data logger for E-Auto with LabVIEW GUI and Microcontroller to measure and record Battery and Supercapacitor bank voltages and currents for internal study.
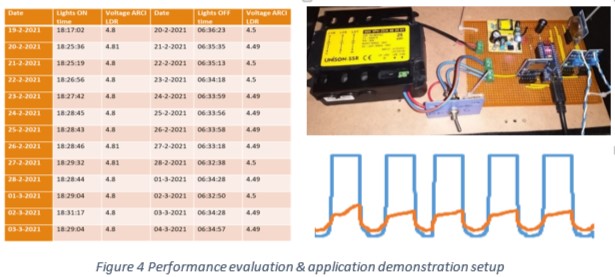
Performance evaluation of LDR and Demonstration for street lights application
- A control and data log setup was developed to demonstrate the application ARCI developed LDR sensor installed on the top of one of the street lamp post.
- Instead of depending on the time, we have introduced ambient light response voltage which will depend only on light intensity.
- A commercial LDR was also connected to the circuit to compare the performance.
- This will ensure the street light switching at the required darkness irrespective of timing.
- A by-pass switch was also incorporated in case the switching of lights is required during maintenance irrespective of LDR sensing.
- The data gets stored in the SD card for extended periods of time to evaluate the performance of ARCI LDR. As shown in Fig 3
- Blue Pulse data- ARCI LDR, Orange Pulse data-Commercial LDR exposed to same conditions.
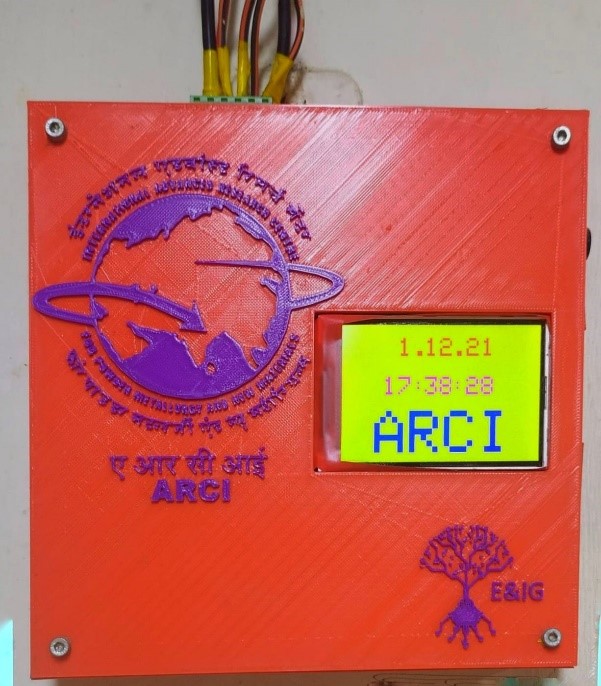
Automatic siren system
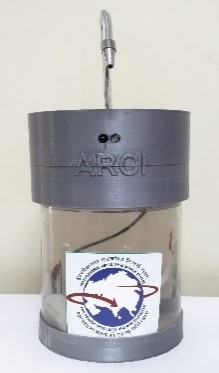
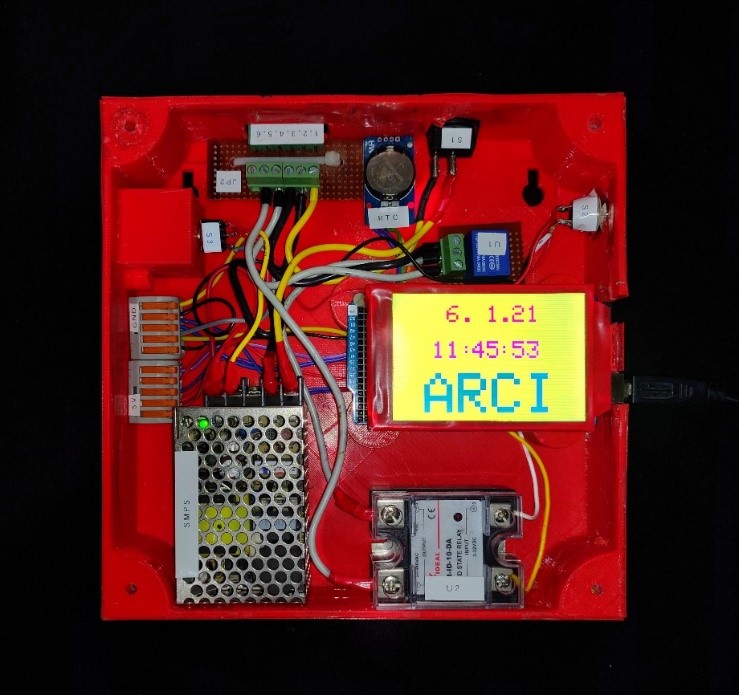
Brief description:The automatic siren system is built using Arduino Mega 2560 microcontroller board along with RTC and SD card shield.
The enclosure shown in Fig.x below is built in-house using the available 3D printer to accommodate the LCD display,
Control boards, Connectors and Switches. Required time spells are programmed and accordingly the siren will ring through SSR for the set pulse width.
Provided Auto, Manual, by- pass provisions for flexibility in operation and maintenance
Implementation of automatic Siren system helps to avoid human errors that may occur with the manual operation.
IoT based water level monitoring system
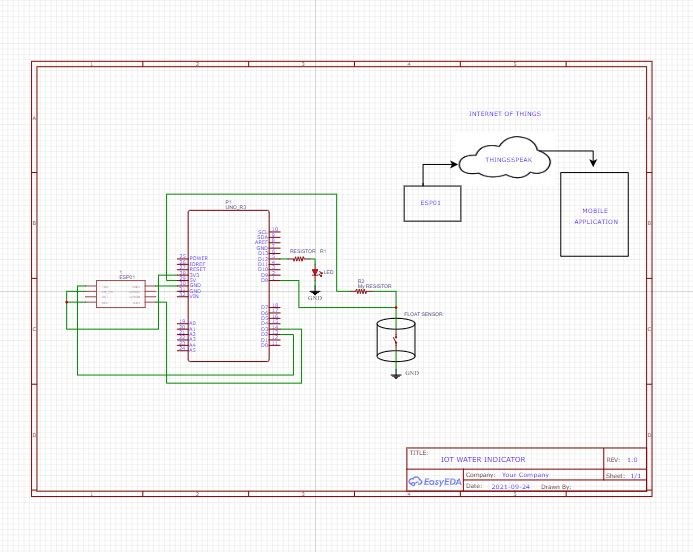
Brief description: Internet of Things (IoT) is all about the network of “things” (i.e. physical objects) that are embedded with sensors, software and
other technologies for the purpose of communicating and transferring data
between the devices and systems over the internet with wireless and remote access
of data and control
- IoT based water level monitoring system
- Using a water level float switch and ESP01 (Wi-Fi Module) to monitor the level of water.
- Code is developed to publish the water level status on a web-server, through cloud using ThingSpeak.com web service.
- The same status is indicated in Android App, MIT App Inventor (in mobile).
- Users have to just down load the above app and receive the status alerts from anywhere and take appropriate action.
- This kind of remote monitoring can be designed and applied to other projects as and when required.
Development of Solar Panels data logger for performance evaluation:
Two Solar Panel Strings installed on the roof top of CEC building were considered for this study.
There are 17 solar panels connected in series in each String and each panel is rated for 45V.
Each string was supposed to deliver a maximum 765V DC under their full capacity based on the sun light falling on the panel surface.
Properly designed Potential dividers have been used to bring down the high voltage DC to a level compatible to Arduino microcontroller which is a maximum of 5V DC.
Hall Effect based non-contact current transducers are used to measure the currents drawn by the loads connected to the strings.
Software is developed to receive the voltages and currents of the solar panels and subsequently get stored in the SD card with the desired sampling rate along with Real Time Clock data.
The connected loads are classified into four groups, depending on the assigned priority level, the highest priority being accorded the lowest rating.
| % State of Charge | Battery voltage level |
|---|---|
| 100 | 12.89 |
| 75 | 12.59 |
| 50 | 12.19 |
| 25 | 11.59 |
Table 1. Charge levels
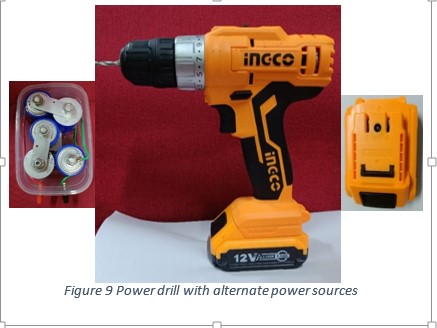
Power Drill with Supercapacitor/Li-ion power source
Demonstrated the application and advantage of fast charging Supercapacitor pack as an alternate source for powering
the commercially available electric power drill operating with Lithium battery pack.
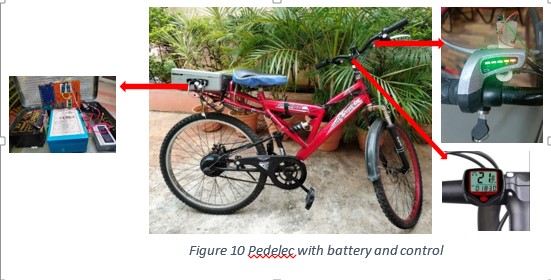
Pedelec Bi-cycle System:
Brief description: A non-electric bicycle was converted to an electric bicycle system (Pedelec-Pedal Electric system) in-house at ARCI by incorporating a 24V DC hub motor,
Peddle Assist sensor, Electronic Speed Controller, Speed sensor, battery, brakes etc.
An Arduino based data logger was developed and attached to the bicycle to acquire and store battery voltage, current, Speed, Distance etc. while riding.
This data can be used for post analysis of load & road conditions and performance of bicycle.
Future scope: This data logging system can be converted to IoT based, where the acquired data is stored in
the cloud and can be retrieved as and when required anytime from any place for analysis.
Charge controller with Automatic Load switching
Conventionally, a solar panel is connected to a battery with load, through a charge controller. The latter is used to protect the battery against overcharging. Likewise, the load and battery are also disconnected from the panel if its voltage falls to a very low value. However, the charge controller does not have a provision to disconnect the battery from the load. We have developed a Charge Controller using an Arduino board to include this additional function as shown below. The status of the battery and solar panel are monitored continuously at all times. The battery is charged by the solar panel, if necessary and if solar power is adequate. However, if the battery or solar condition is found to be unsatisfactory resulting in very low output, the battery is isolated from all loads to prevent possible damage on account of under-voltage operation.
| % State of Charge | Battery voltage level |
|---|---|
| 100 | 12.89 |
| 75 | 12.59 |
| 50 | 12.19 |
| 25 | 11.59 |
Table 1. Charge levels
- If the solar panel output is not sufficient, it is disconnected from the Battery by the charge controller.
- If the panel voltage is okay and the battery is fully charged, it is allowed to energize the connected loads.
- If the panel voltage is okay and the battery is not fully charged, the loads will be disconnected in proportion to the discharge level as per their assigned ratings. This will ensure that loads with higher priority take precedence over others.
- If the battery is totally discharged i.e. < 10.5 V, all loads are disconnected.
Automation of Arc Discharge Setup for Synthesis of Carbon Nano tubes
A DC Arc discharge setup is employed at ARCI for the production of carbon nano tubes. An arc is produced between two Carbon rods arranged vertically inside a double walled stainless chamber. The upper rod, which is the anode, is moved by a motor and gear mechanism so that it can be moved towards or away from the lower carbon cathode. The cathode deposits that are produced during the arcing contain multi walled carbon nano tubes.
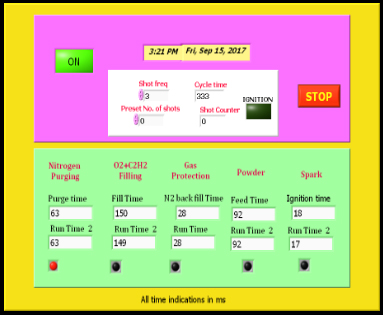
Front Panel of DSC Virtual Instrument
This production set up has been automated using a PLC and touch screen type HMI panel as shown below.
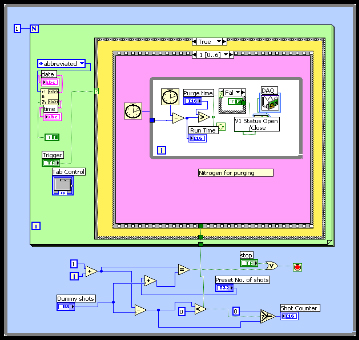
Block diagram of DSC Virtual Instrument
Development of a PC /PLC based system for Detonation Spray Coating process
The denotation method of depositing coatings relies on gaseous explosion to heat and accelerate fine particles of a powder material which, on collision with a fixed target, bond with it to form a coating on its surface.
The complete sequence of operation is as follows:-
- 1st Stage: Inert Nitrogen gas is let in to flush out retained particles, if any.
- 2nd Stage: Fuel gases i.e. Oxygen and acetylene are simultaneously introduced
- 3rd Stage: Nitrogen is let in again to forward the fuel gases in to the detonation chamber and to form a protection barrier.
- 4th Stage: The gas mixture is ignited by a spark and powder is injected axially into the barrel
The sequence described above is implemented by opening and closing a series of solenoid valves that control the flow of different gases and the ignition circuit. Fig.1& Fig. 2 shows the front panel and block diagram of a PC controlled DSC system developed using National Instruments LabVIEW software.
Basic scheme of the test setup
A PLC program as shown in Fig.3. has also been developed using a Siemens micro PLC and tested by conducting experiments on existing Detonation Gun.
Hardware is implemented using MOSFETs for driving solenoid valves and ignition control and the same has been utilized for both PC and PLC.
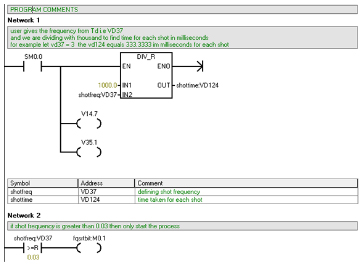
Portion PLC ladder logic for DSC
Design and Development of a test set up for comparison of Solar PV panel parameters
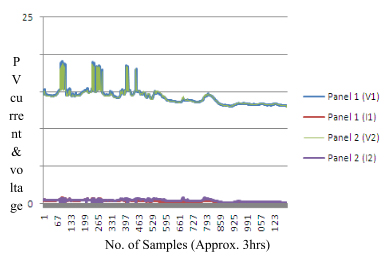
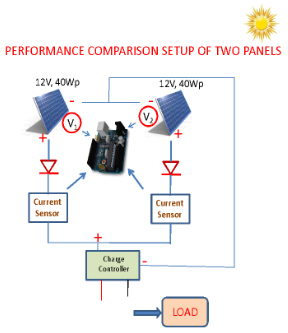
A simple microcontroller based test facility was set up for comparing the power outputs of two solar PV panels each 12V, 40Wp under identical test conditions as shown in Fig.1. The two devices under test are placed side by side so as to receive the same solar radiation. The outputs of both were connected to a single charge controller through rectifier diodes and current sensors. A battery and load were connected to the charge controller, as is done conventionally. In this way, the same load shares the solar energy generated by the two panels. If the voltage generated by any of the panels is more, the corresponding current drawn from that panel is more and vice versa.
The values of current and voltage with desired sampling rate and with respect to real time clock are continuously logged to a memory card whose stored data can be transferred to any PC in excel format to be used for post analysis as shown in Fig.2.
